Book a demo Open live dashboardLive data
AI-Driven monitoring and control for buildings

Every building breathes.

Monitor. Control. Save energy.

Wall-GapS

The whole wall breathes in.

Sunny wall42.2°C
Wall-GapS22.9°C
Every panel

Cooler, cleaner air.

Intake air29.0°C
Measured on the pilot21.4°C
Sense

Measured around the clock.

  • Temperature
  • Humidity
  • Particles
  • CO2
Monitor

It sees the problem.

Control

And switches it on.

Then

Heat and dust go down.

Result

Cooler. Cleaner. Automated.

  • 7.6 °C cooler air
  • Up to 50% less PM2.5
  • Less cooling power
Data centre
A2P-Logger
Air quality High pollution Lower pollution Clean, cooled air (Wall-GapS)
https://app.air2pure.com Illustration
  1. 1
    Detected
    Temperature 29.0 °CHigh PollutionHigh
  2. 2
    AI switches Wall-GapSOffOn
  3. 3
    Result
    29.0 °C intake air 50% less pollution

Sense. Stream. Understand. Act.

  1. SenseAt the air intake
  2. StreamOver LTE or WiFi
  3. UnderstandkWh, euros, CO2
  4. ActAI switches what is needed

Your air, minute by minute.

https://air2pure.com/live Recorded data
16 Oct 2025, 00:00 UTC
Temperature°C
Particlesµg/m³
CO2ppm
Controls Auto (AI) Wall-GapS Fans Illustration
How we calculate

Air mass flow 1.2 kg/m³ × airflow. Cooling avoided mass flow × 1.005 kJ/kg·K × (outdoor − intake), only when positive. Electricity cooling ÷ COP, COP 4 by default. Cost kWh × price. CO2 kWh × grid factor.

Shown here: recorded data from PurCity's own A2P-Logger, 11 to 16 Oct 2025, played back. Times in UTC.

For large buildings that cool their air.

Data centres
Factories
Warehouses
Malls
Airports

Digital and physical.

Two systems that work together.

1Digital

Air2Pure

  • Monitors the air, online
  • Controls fans and Wall-GapS, remotely
  • Shows what you save

Together: Air2Pure finds the problem, Wall-GapS removes it.

Measured on a real building.

Pilot hosted by Toyota Motor Europe, Brussels, Belgium. No endorsement is implied.
7.6°Ccooler intake air
19.3°Ccooler facade
up to50%less PM2.5
up to90%less PM10
up to49%less cooling electricity (climate dependent)
47%less cooling electricity in a 5 MW data centre, Brussels
Before16,434 MWh a year
With Wall-GapS8,738 MWh a year
Model estimate

5 MW IT load, PUE 1.56 to 1.38, chiller COP 4, 1,000 m² of Wall-GapS.

18 international awardsPatent pendingPurCity ApS, Copenhagen

What could you save?

Model estimate

Example, Brussels: 638 warm hours a year, chiller COP 4, 0.127 kg CO2 per kWh (PurCity calculator).

11.5kWless chiller power
€974saved a year
0.9tless CO2 a year
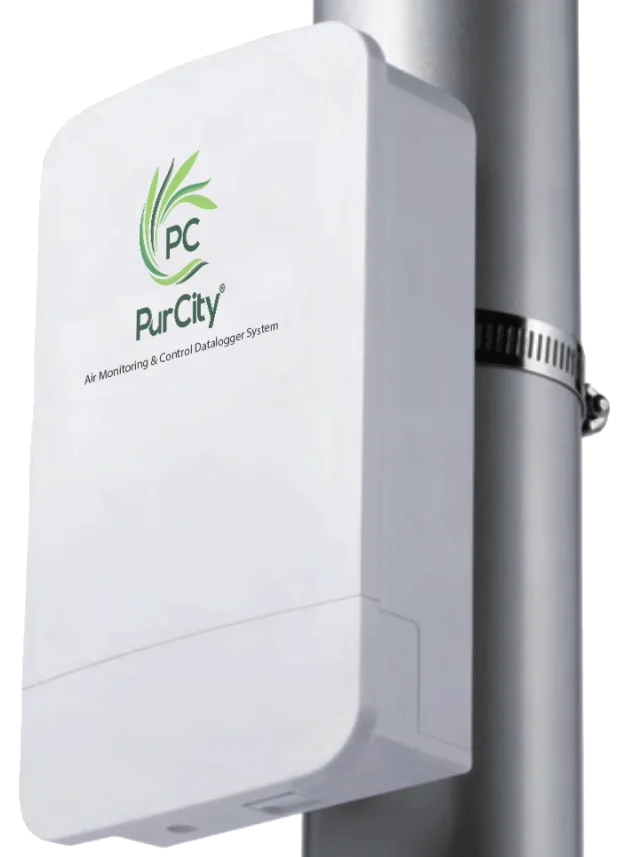
The A2P-Logger, Air2Pure's air monitoring and control datalogger, mounted on a pole
A2P-Logger

See it on your building.

Chat with us
AI Assistant
Chat ended automatically due to your inactivity. Feel free to start it again.